1. How to simulate the AR(1) model in stata
The AR(1) model is used to check the stationary property of the series.
Consider the following AR(1)
Yt=bY(t-1)+et
Where, et is an iid white noise process with mean 0 and standard deviation 1.
We will simulate this regression for various values of b : 0.1, 0.5, 0.8, 0.90, 1
The stata codes for b=1are :
clear
set obs 10000
gen obs = _n
gen et=rnormal(0,1)
quietly gen yt = et in 1
quietly replace yt = 1*yt[_n-1] + et in 2/L
egen i=seq()
tset i
tsline yt
set obs 10000
gen obs = _n
gen et=rnormal(0,1)
quietly gen yt = et in 1
quietly replace yt = 1*yt[_n-1] + et in 2/L
egen i=seq()
tset i
tsline yt
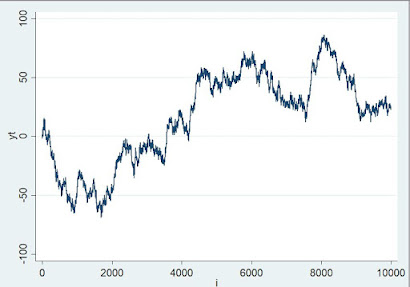
Paste these codes in stata and you will see a plot like this:
Pls keep in mind that every time you run and rerun the code, you will find a different graph. However, as we can see , the variable yt is clearly non-stationary i.e. its mean value and variance is changing over time.
Now let us check b=0.1
clear
set obs 10000
gen obs = _n
gen et=rnormal(0,1)
quietly gen yt = et in 1
quietly replace yt = 0.1*yt[_n-1] + et in 2/L
egen i=seq()
tset i
tsline yt
set obs 10000
gen obs = _n
gen et=rnormal(0,1)
quietly gen yt = et in 1
quietly replace yt = 0.1*yt[_n-1] + et in 2/L
egen i=seq()
tset i
tsline yt
If you check b=0.5,0.8 and 0.9, yt would behave as a stationary series just as in the case of b=0.1.
You can check it one by one.
A series of random walks can be generated by running the following codes in stata.
clear all
set seed 123
set obs 1000
egen i = seq(), block(100)
bysort i : gen t = _n
xtset i t
gen e = .
tokenize "1.0 0.5"
forval j = 1/2 {
qui replace e = rnormal()
gen y`j'= 0 if t == 1
replace y`j' = ``j'' * L.y`j' + e if t > 1
}
line y1 t if _n < 1000, c(L) scheme(s1color)
set seed 123
set obs 1000
egen i = seq(), block(100)
bysort i : gen t = _n
xtset i t
gen e = .
tokenize "1.0 0.5"
forval j = 1/2 {
qui replace e = rnormal()
gen y`j'= 0 if t == 1
replace y`j' = ``j'' * L.y`j' + e if t > 1
}
line y1 t if _n < 1000, c(L) scheme(s1color)
This will produce a group of series like below:
You can also download the do file here


14 comments:
I salute for your vehement thoughts towards Econometrics.. Thanks.. It was of great support.
Thank you Binod Bro! Inspired more by your appreciation to post the whole stuff about data analysis and estimation techniques using Microfit, STATA and E-views
Sir can you post the VeCM if possible Impulse response function.
Sure! Samir Ji.. But You have to wait for few days....
Siddha sir how can we estimate f stat in microfit 4.1?
Niraj ji...I am not sure which F stat you are talking about? Is it variable deletion/addition test? Please, clarify it to me?
Niraj ji...I am not sure which F stat you are talking about? I it is variable deletion/addition test? Please, clarify it to me?
Thank you sir for this post it is really great help for me to understand Microfit 5... Sir if it is possible can to make post on How to do ARDL Bound test using Microfit 5.
in demo version order of ardl is limiting is it possible in full version to makee order of ardl 8 ?? if it is possible I am thinking to buy it
Hello sir , I am interested to join this programme could you please inform
that when will be the training started .
please fill the form at https://docs.google.com/forms/d/e/1FAIpQLScGuLCHQE8BDUXJkMUm9JduwpQmW9E16KvFW69ZRelQR9RD6A/viewform
Sir, Can you please post the Class Of Day 1,
Dear Dai, It would have been better if the dataset that you provided had a simple description of each of the variables? The presentation was excellent and informative.
Thank you sir...
Sir I am student of MA Economics (RR Campus, T.U) and i am writing my thesis on Johannesson Co Integration in R. I have coded and found co integraing condition at 4 lags (lags directed by AIC) with at most 1 co integrating equation. I then ran VECM with (p-1) lags and found that ECT is negative and is significant at 95% C.I.
Now i want to run diagnostic test. So to run it,should I have to convert vecm to var? Suppose to run serial correlation test should I have to convert the vecm to var and run P.asymptotic serial test in R ? The code that I used in R is:
SerialCorr <- serial.test (ModelVar, lags.pt = 4, type = "PT.asymptotic")
When I ran this in R it gave insignificant results but when I run serial correlation in E Views it gives significant results, so I am confused. So sir, am I using the correct command in R ? Please suggest.
Aditya Raz Pokhrel, MBA(PU)
MA Economics (4th sem, TU)
Post a Comment